
| Publisher | Creator Economy Weekly |
|---|---|
| Release Date | 2024-07-15 |
| Category | Creator Economy |
| Platform | Web |
This trend caught my eye because “6.7×” has become the magic bullet in every deck I review. I’m a micro-creator believer—I’ve seen a 25-creator portfolio beat a glossy brand asset library repeatedly—but waving 6.7× around without footnotes is a disappointment waiting to happen. Let’s cut through the spin, unpack the real math, and share concrete steps both brands and creators can take.
Key Takeaways
- 6.7× ROI on engagement and CPA is attainable when you match niche micro-creators to product intent—but most headline stats ignore COGS, rights fees, and ops.
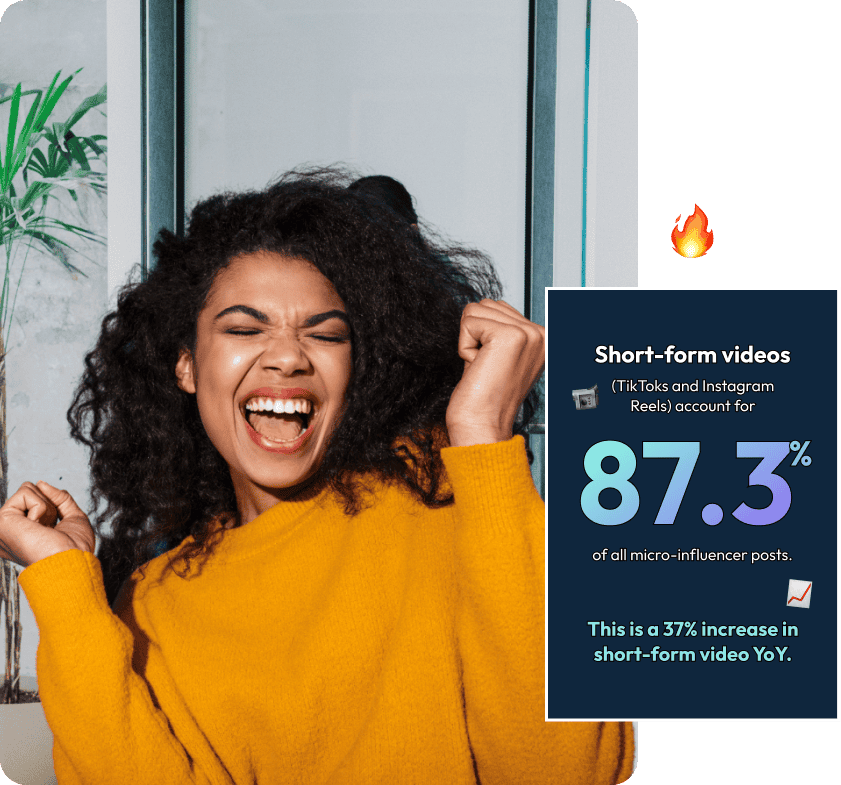
- Micro-creators win on authenticity, precision targeting, and repurposability; their UGC often doubles as top-performing paid ads (see TikTok Spark Ads).
- Best practice: run 20–100 micro-creators on a base + performance model, lock down usage rights, and maintain a relentless creative testing pipeline.
- Watch for hidden costs, attribution gaps, creator fatigue, and platform algorithm shifts; measure CPA, LTV/CAC, and incremental lift, not just likes.
| Industry Rundowns & Sources | |
|---|---|
| Impact.com Report (Jun 2024) | impact.com/creator-economy-report |
| Aspire 2024 Influencer Analysis | aspire.io/report |
| inBeat Platform Metrics | inbeat.co/blog/creator-statistics |
| Stack Influence Benchmark | stackinfluence.com/benchmarks |
Context: Why 6.7× Is Real—but Partial
Micro-creators (1K–100K followers) average 4–7% engagement vs. 1–3% for macros, and hyper-targeted niches drive tighter click-to-purchase intent. According to the Impact.com 2024 Creator Economy Report, a portfolio of 30 niche TikTok micro-creators hit 6.7× efficiency on CPA compared to brand video ads (Impact.com, 2024). Aspire’s 2024 Influencer Analysis found average ROI in the 5–8× range, with outliers hitting 10–12× when affiliate links and evergreen YouTube tutorials were layered in.
Real talk: that 6.7× figure usually excludes hidden line items—cost of goods sold (COGS), shipping, creator management software, and post-production. Once you layer those, screenshots of “13:1” ROAS often wind up around 3–6× net profit. Still compelling—but let’s not pretend it’s cost-free magic.
Performance Drivers: Where the Upside Comes From
- Trust + Niche Intent: A micro-creator recommending a hydration powder to a 50K-member running community converts like a friend’s advice—friend-to-friend vs. ad-to-consumer.
- Evergreen Formats: YouTube tutorials and SEO-optimized blog posts keep driving affiliate and direct sales months after launch—unlike feed content that decays in 48 hours.
- Paid Amplification: UGC whitelisted as Meta Branded Content Ads and TikTok Spark Ads often outperform brand creative by 20–30% (inBeat data, May 2024).
- Portfolio Math: Ten micro-creators averaging 7% engagement will collectively outperform a single macro at 1–2%, and you hedge creative underperformance.
Case Study: Beauty Brand X
Budget: $75K over 3 months | Creators: 35 TikTok & Instagram micros (5K–80K followers) | Model: $1K base + $500 bonus per 1,000 tracked sales | Whitelisting budget: $15K
- Average engagement: 8.2% (vs. 1.8% brand average)
- CPA: $5.20 vs. $32.40 for brand videos
- Incremental sales: $310K (4.1× net ROI after COGS and ops)
- Evergreen lift: 12% of total sales occurred outside the paid window via YouTube tutorials
Key lesson: the blend of evergreen content + paid uplift nails both short-term spikes and long-tail compounding.
The Hype Slide Omits
- Hidden Costs: Agency fees, platform fees, content rights (typically 12-month global digital), shipping samples, and whitelisting spend can tallies up to 15–25% of your total budget.
- Attribution Chaos: Promo codes undercount view-through (UTM link tests by Stack Influence show up to 40% dark social). Last-click affiliate often overclaims. Solution: unique UTM parameters, server-to-server event tracking (Facebook Conversions API), and a mix of last-click, view-through, and incrementality tests.
- Scaling Ops: Managing 50+ creators demands contract templates (see box below), FTC disclosure tracking, brand safety QA, and payment automation. Without workflow software like Traject or CreatorIQ, ops burn can wipe out ROI.
- Algorithm Decay: TikTok SEO and YouTube Shorts boost evergreen reach—but algorithms shift. Plan refresh cycles every 4–6 weeks.
Sample Contract Snippet
Usage Rights:
  - Channels: Organic + paid on TikTok, Instagram, YouTube
  - Duration: 12 months from publication date
  - Geography: Global digital rights
  - Fee: Base content fee + $0.10 per paid impression
FTC & Brand Safety:
  - Creator to include platform-mandated disclosures
  - Brand retains final approval on every post
Performance Bonus:
  - $500 per 1,000 tracked sales, validated via unique affiliate link
Metrics & Measurement Templates
- CPA formula: Total Spend ÷ Tracked Conversions. Target: <$10 for DTC, <$25 for high-ticket items.
- LTV/CAC ratio: Customer Lifetime Value ÷ Customer Acquisition Cost. Aim >3:1 for sustainable growth.
- Attribution windows: 1-day click, 7-day click, 7-day view; run parallel incrementality tests monthly.
- Evergreen lift metric: (Organic sales + affiliate revenue) ÷ total campaign sales. Good benchmark: ≥10%.
Brand Playbook: From One-Off to Always-On
- Build a quarterly roster of 20–100 micro-creators per major product line; stagger content drops.
- Implement a base + performance fee model; allocate 15% of budget to whitelisting top 20% of posts.
- Use contract templates to lock usage terms, disclosure, and performance bonus triggers.
- Measure CPA, LTV/CAC, and incremental lift; drop reliance on vanity engagement rate alone.
- Test 5–10 distinct creative hooks (tutorial, comparison, “I wish I knew,” POV); refresh winners every 4–6 weeks.
Creator Playbook: Capturing Your Value
- Negotiate a guaranteed floor + performance bonus or affiliate rev share. Don’t cede usage rights for free.
- Invest in evergreen channel assets: YouTube tutorials, blog posts, or newsletters to compound long-tail traffic.
- Define explicit whitelisting terms: platforms, spend caps, geographic scope, and duration. Charge a separate fee.
- Provide post-campaign dashboards: engagement rate, reach, audience demographics, CTR, conversion rate. Make renewals frictionless.
Conclusion
I’ve managed creator portfolios north of $1M in spend, and here’s the bottom line: micro-creators deliver on the 6.7× promise only when treated as a distributed creative team—complete with fair pay, rigorous measurement, and process muscle. The stat is the promise; workflow discipline and creative iteration are how you capture it.
TL;DR
Micro-creators can outpace brand content by ~6–7× on CPA and engagement—but only when you control for hidden costs, streamline ops, and run an always-on, performance-driven creative engine. Brands: diversify your creator roster, pay base + bonus, and lock usage terms. Creators: anchor fees, negotiate whitelisting, and own evergreen content to compound your value.